Bond Skewness in Portfolios

Skewness measures the asymmetry of return distributions, influencing investment risk-return profile, making it an essential statistical tool for portfolio management. Equity returns exhibit a negative skew, whereas Bond returns exhibit a neutral or slightly positive skew. However, there are certain market conditions for bonds with positive skews and situations where they might be the most effective. Therefore, it is possible to identify conditions where bonds are more desirable to hold in a diversified portfolio.

  • Negative Skew (Left-Skewed): The left tail (representing negative returns) is longer or fatter than the right tail. This implies that there are more frequent or more severe negative outliers. For equities, panic selling during downturns exacerbates negative returns, while exuberant buying during upswings may not sustain similarly dramatic positive returns.
  • Positive Skew (Right-Skewed): The right tail (representing positive returns) is longer or fatter than the left, indicating more frequent or significant positive outliers. Since bonds have a very strong and inverse relationship with interest rates.

Bonds generally exhibit neutral to slightly positive skewness, particularly in stable economic environments where interest rates are not near their lower bounds. When bond yields approach zero or become negative (as seen in some economies post-GFC and during Covid), the traditional advantages of bonds diminish. This reduces their positive skewness and effectiveness as a hedge against economic shocks. On the other hand, if yields are far above zero, they act as an insurance policy due to their positive skewness and offer some protection to the portfolio. This can lead to significant bond melt-ups in three situations:

  1. Sharp sell-off in equities and other risk-assets
  2. Disinflationary economic shock (unemployment gapping upwards)
  3. Disinflationary exogenous shock (example: GFC, Covid)

Therefore, with yields far above zero, investors can leverage these positive skewness characteristics of Bonds to safeguard their portfolios against unexpected economic disruptions and market volatility. A starting position in which bonds are deeply oversold offers a higher propensity to melt up and a much more significant benefit for the portfolio.

Services stabilize the economy

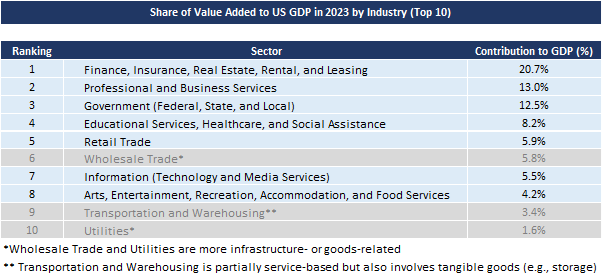
The service economy demonstrates a sustainable pattern of spending, supported by its inherent diversity and the essential nature of many services. This growth trajectory can only be significantly disrupted by a strong exogenous shock that affects multiple industries and leads to a recession. As a result, the service economy has gone into recession only twice in the last 25 years: during the pandemic and the Global Financial Crisis (GFC). Therefore, services have a stabilizing effect on the overall GDP trajectory.

Due to technological innovation, globalization, outsourcing, and the shift in consumer demand, the service sector has become a larger part of the economy. Now, it consistently accounts for around 77-78% of GDP. As a result, the US economy as a whole has become more resilient.

Depending on how AI is integrated into the economy, this might be challenged in the future. This is due to the expected large-scale job displacement of service jobs, reshaping consumer behaviour and uneven distribution of accelerated productivity.

Demand and expectations

The financial market is driven more by expectations of future demand than by past fundamentals. It is an emotional theatre where stories, narratives, and psychology dictate direction far beyond the underlying fundamentals.

Golden Rule for bond portfolio duration

Bond markets are forward-looking, pricing in expected monetary policy moves. Surprises occur when a central bank’s actions or communications deviate from these expectations. These banks significantly impact bond prices and returns as the market reprices bonds based on new, unexpected information. Monetary policy surprises can stem from changes in the ‘policy rate’ quantitative easing (QE) announcements or shifts in forward guidance.

Since reliable estimates are difficult to form beyond a year, surprise is typically defined as the deviation between 12-month market expectations and the actual policy changes over that period.

Monetary policy surprises are the key driver behind relative government bond returns. Given the inverse relationship between bond prices and interest rates, a dovish surprise—such as lower interest rates or looser monetary policy (e.g., an unexpected rate cut or QE announcement)—reduces yields, boosting bond prices and improving relative performance.

Golden Rule

Increase the duration of bond holdings in countries with the highest likelihood of a dovish surprise.

The basis for the Golen Rule:

  1. Capitalizing on Policy Divergence: Investors can take long positions in bonds from countries with dovish central banks to exploit the resulting price appreciation.
  2. Historical Outperformance: Countries with the largest dovish surprises tend to outperform, with the most significant outperformance observed in countries’ bonds delivering unexpected easing measures.
  3. Consistent Performance Over Time: Investing in bonds from countries with frequent dovish surprises has proven to generate superior returns.

Indicators of Potential Dovish Surprise

Several conditions signal room for easing and increasing the probability of dovish action:

  • Policy-Neutral Rate Gap: A large positive gap (policy rate > neutral rate) suggests significant room for rate cuts.
  • Low or Decelerating Inflation: Inflation below the central bank’s target supports a dovish stance.
  • High or Rising Unemployment: Weak labour markets often prompt central banks to ease.
  • Slowing Growth or Recession Risk: Economic slowdown increases the likelihood of looser monetary policy.

Given these observations, one should allocate more to government bonds of countries where the gap between the policy rate and the neutral rate is the widest and inflation is below target, as these conditions signal the highest likelihood of a dovish monetary policy surprise. Prioritize higher-duration bonds to maximize gains from falling yields.

However, global policy coordination (central banks acting in tandem, reducing relative surprise) or external shocks (geopolitical or macro events) add to the strategy’s risk. Furthermore, the neutral rate is not observable and difficult to estimate; estimating the ‘policy rate–neutral rate gap’ is speculative.
Buybacks are typically beneficial

Buybacks are beneficial payouts as they are typically taxed more favourably than dividends*. A 1% buyback tax was introduced in the US in 2023 and increased to 4% in 2025.

Buybacks increase shareholder ownership and can boost earnings per share (EPS) by reducing the number of shares outstanding, even if overall profits remain flat. Buybacks can be especially beneficial when companies repurchase shares at prices below their intrinsic value.

From another perspective, buybacks are often viewed as a positive signal because they suggest that the CEO, who has insider knowledge, believes the shares are attractive at current prices. They can also signal financial strength as the companies that typically issue buybacks are often mature, financially stable firms with excess cash flow. On the other hand, similarly to dividends, companies may buybacks when growth opportunities are limited.

Shareholders must carefully observe if buybacks are not excessive, draining too much liquidity or if they come at the expense of long-term investments, which can harm future growth.


*Qualified dividends are taxed at long-term capital gains tax rates lower than ordinary income tax rates. For a dividend to be qualified, the stock must generally be held for at least 60 days during the 121 days surrounding the ex-dividend date.

  • 0% tax rate if your taxable income is up to $44,625 (single filers) or $89,250 (married filing jointly) for 2023.
  • 15% tax rate if your taxable income is between $44,626 and $492,300 (single) or $89,251 and $553,850 (married filing jointly).
  • 20% tax rate if your taxable income exceeds $492,300 (single) or $553,850 (married filing jointly).

Signals from the housing market

Housing is a leading economic indicator due to its sensitivity to interest rates and economic sentiment. When housing demand weakens, it often signals broader economic challenges, such as reduced consumer confidence, tighter credit conditions, or slowing job growth.

The housing sector exerts a significant multiplier effect on the economy, where changes in housing demand ripple through various sectors and amplify economic impacts. A decline in demand can reduce construction activity, lower the need for building materials, and negatively impact industries like furniture, appliances, and real estate services. Additionally, it can diminish state and local government revenues from property taxes, further straining economic conditions.

Faltering housing demand typically reflects tightening financial conditions or structural challenges, making it a critical early warning sign for economic slowdowns. While housing booms support economic growth, they can also create systemic risks when driven by excessive leverage or lax credit standards, often leading to instability when conditions reverse.

Elections and equities

As the U.S. presidential elections approach, the equity market’s volatility tends to increase and remain stable. Historically, volatility tends to subside immediately after the election, regardless of the winning candidate. On average, markets have seen about 5% gains in the first 1 to 3 months post-election. Over a longer period of 6 to 12 months, returns are typically higher if the incumbent party wins, as this protects the status quo and supports existing trends.

This phenomenon coincides with seasonality. On average, the months of August and September tend to be more negative and volatile. This is exacerbated in election years since the U.S. presidential elections are always held in November.

Turnover erodes compounding

For heavily taxed investors, the benefits of holding onto their investments as long as they continue to grow and compound are significant. Selling investments triggers taxes, which reduce the amount of capital available for reinvestment. As a result, the new investment would need to generate a significantly higher annualized return to match the after-tax value of the original investment. Therefore, avoiding unnecessary sales is a key strategy to preserve more capital for compounding over the long term.

High turnover can also increase explicit costs such as fees and transaction costs because each trade typically incurs brokerage fees, custody feed, and applicable market costs. In addition, the larger the trade, the higher the impact of implicit costs, such as market impact and bid-ask spreads.

The less taxes and transaction costs paid, the more money invested.

“Our favourite holding period is forever” Warren Buffet, 1988.

Follow the leaders

The market’s strongest stocks often set the tone for the rest. Their performance can be viewed as a guide for broader market movements. One should be more cautious if a leading stock shows signs of exhaustion, if they are technically extended on a very bullish sentiment, or if they break down below key support levels without significant fundamental news. Monitoring the narrative around leadership stocks and watching their fundamentals is important.

Tempestuous price and serene fundamentals

Fundamentals tend to be serene, while prices are tempestuous. Market sentiment, news reconciling large information asymmetry, events resetting expectations, liquidity, momentum, and technical factors are all responsible for these dynamics. Understanding the stimulant of a large price move is an integral part of an investment decision.