US stock-market is largest in the world and continue to be among the deepest, most liquid and most efficient markets. US market depth and breadth enables individual investors diverse choice like no other markets. Also dominant position of multinational corporations listed in US allows for global geographical diversification of the revenues which makes them more resilient but also allows to rip some benefits of the growth in Emerging Economies. While US Remains the world’s largest economy since 1871, currently at 23.6% share (GDP of $21.44t); US stock-market represents much bigger portion of the world’s equities at 54.5%. Given its dominance, importance and growth, the critical question is – who owns the US stock-market?
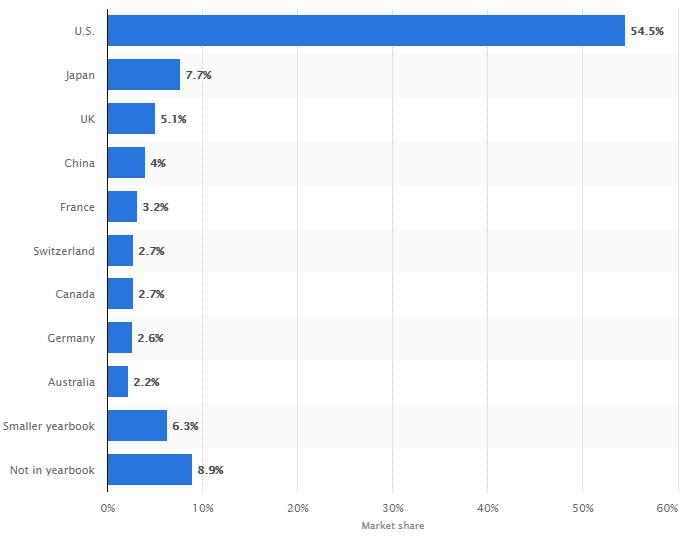
So who owns the stocks?
It is mostly households, which accounts for 37.6% of the total equity market, followed by Mutual Funds at 22.5% which assets are also owned by households (direct and indirect ownership).
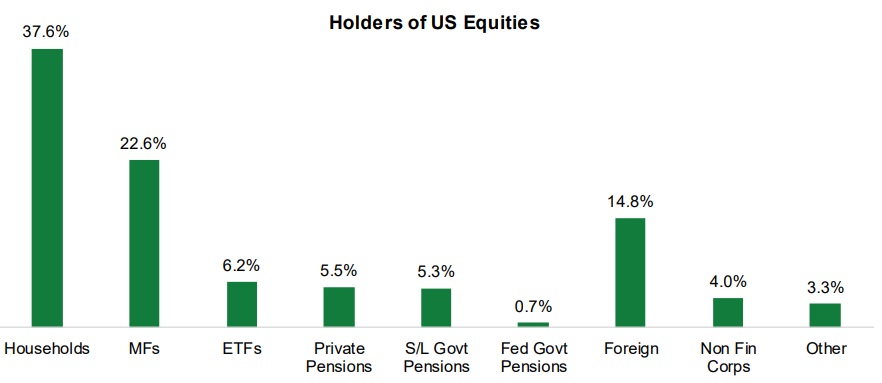
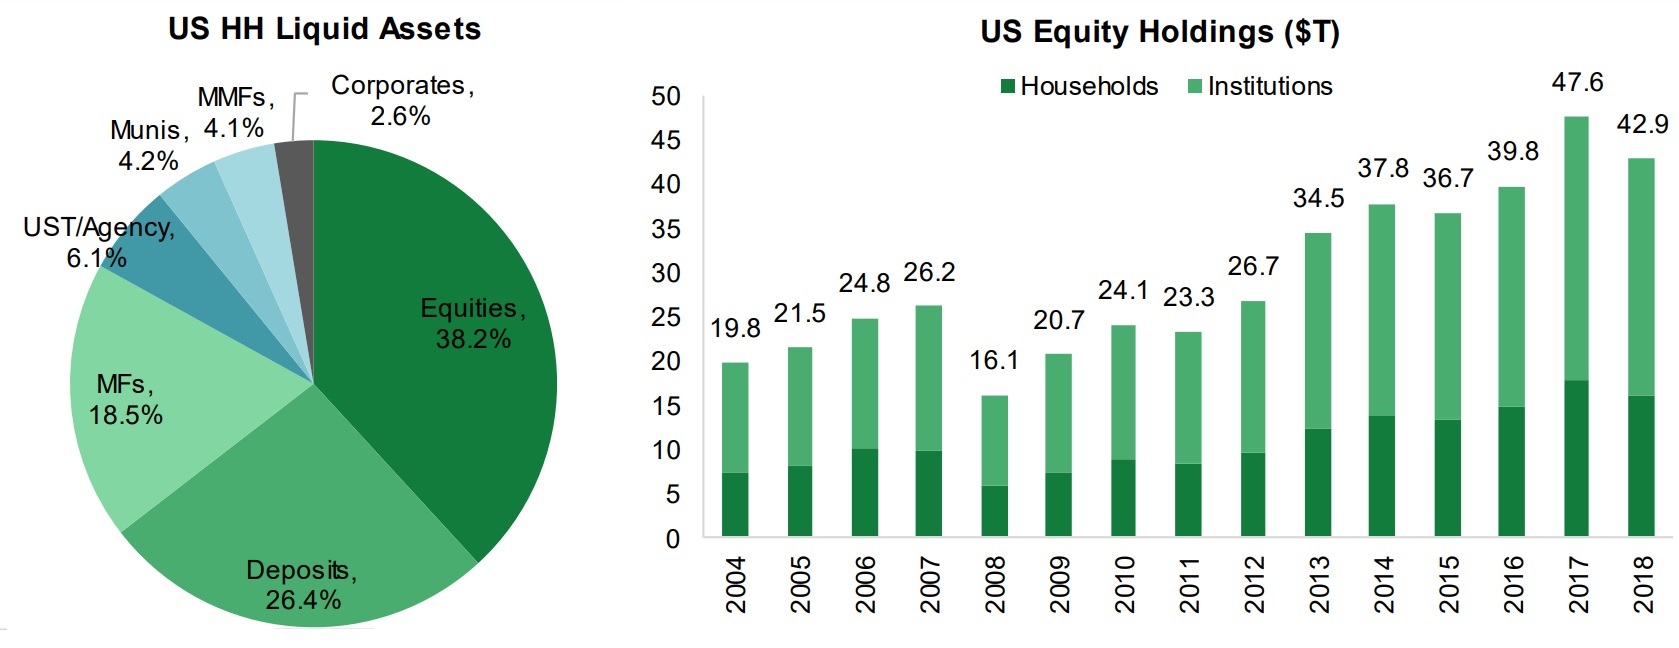
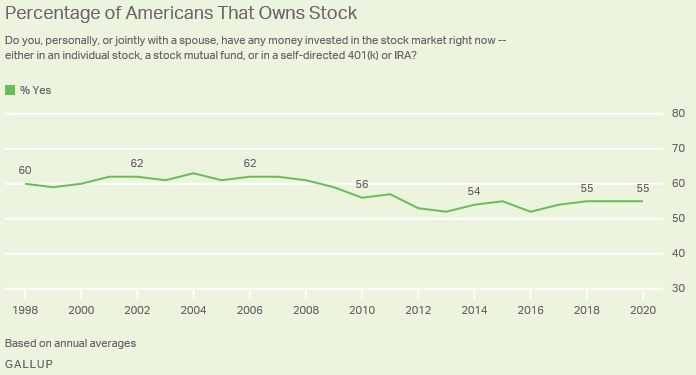
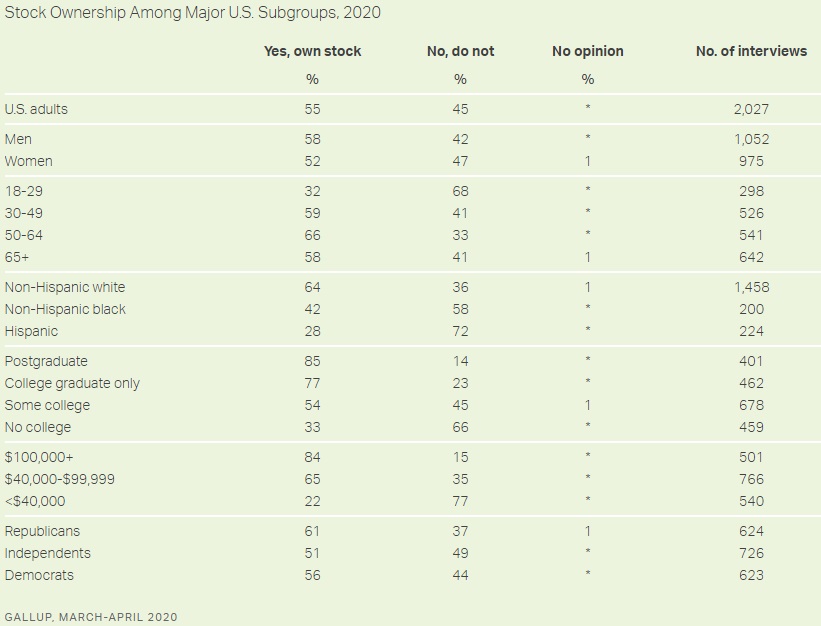
These are the figures, but if we break down US households we can tell a bit more about share of ownership. Based on Gallup’s polls conducted in March and April this year, only 55% of Americans owns stocks (Gallup 2020). In comparison Federal Reserve Bulletin shows stock ownership at 52% (FED Bulletin, Sep 2020). Both sources shows decrease in stock ownership, down from 62% in most of the 2000’s. Decline is related to financial crash and 2007-09 recession from which stock ownership has not fully rebounded. Gallup survey also found strong correlation between stock ownership and income, education, age and race.
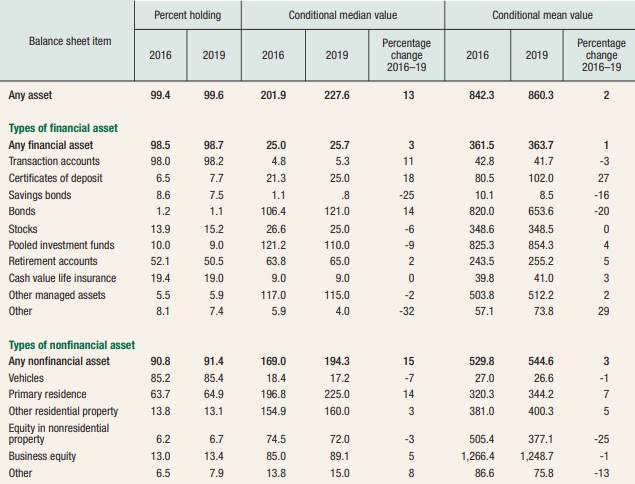
It is important to highlight that more than half of the households net worth in US in linked to their retirement accounts, this also represents 52% of the world’s retirement assets (SIMA, 10/2019) with median value of retirement account of $65,000 and mean of $255,200. Overall median value of all financial assets held by American families is $25,700, in comparison the mean value is £363,700 (FED Bulletin, Sep 2020). Massive difference between mean and median reflects skew in distribution of financial assets. This is also linked to stock ownership which is positively correlated with percentile of income (the more you earn, the more likely you hold the stocks either directly and indirectly). What is worth noticing is that although recovery in stocks ownership after the financial crisis is slow, its driven by households earning below average income. In contrast recovery in years 2013-2016 where lead by top 10% of income. (FED Bulletin, Sep 2017).
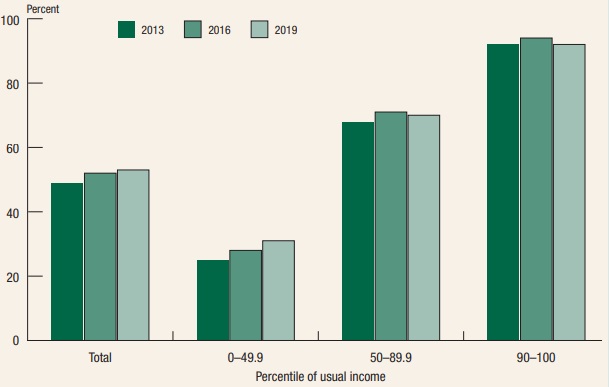
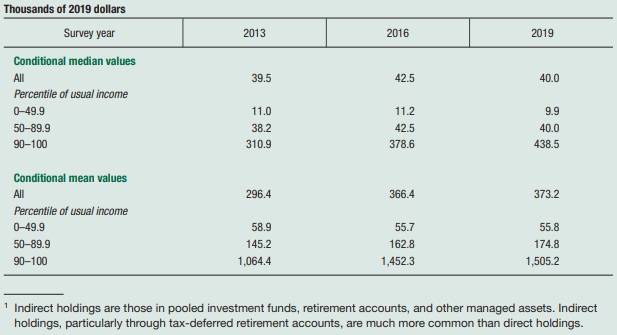
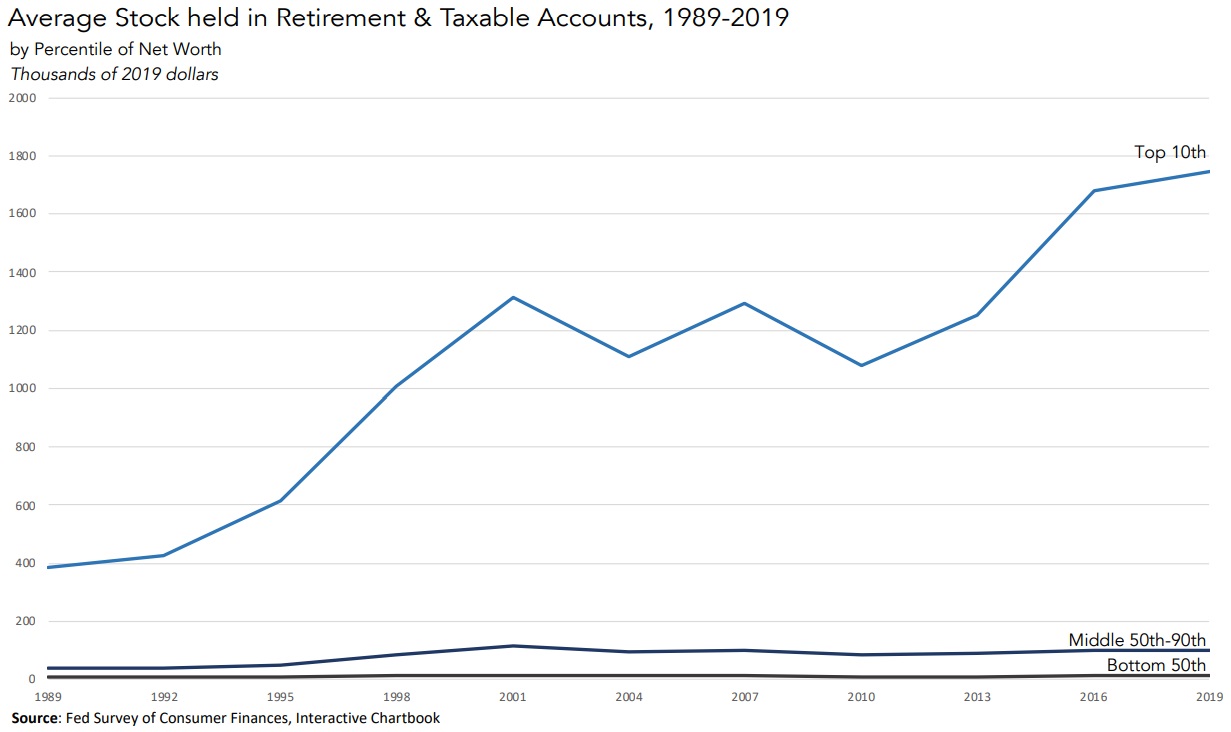
Based on above figures we can immediately see uneven distribution of the financial assets. Wealthier households does not only own higher portion of their wealth in stocks, they also own more, much more of it. The difference is striking when comparing total stock holdings (direct and indirect) of the bottom half with top 10%. Top 10% household own on average $1.7m of stocks, where bottom 50% owns only $11,000.
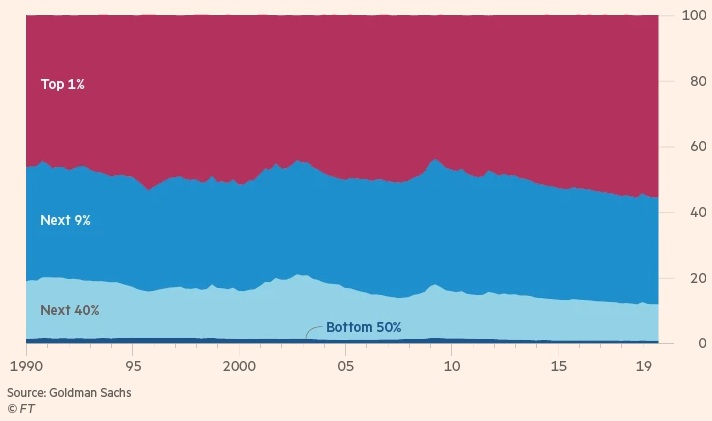
We can also compare how the share of stock ownership was changing for those percentiles. We can see that in last 30 years richest 1% of Americans grew it’s share of equity ownership from around 45% in 1990 to over 50% currently. According to Goldman Sachs “Since 1990, the wealthiest have bought a net $1.2tn in company stakes, while the rest of the population has sold more than $1tn”. Financial Times explains this widening gap in shares ownership as an result of stagnant real wages in last few decades (FT, Feb 2020).
References:
-
FED Bulletin, Sep 2020. “Changes in U.S. Family Finances from 2016 to 2019: Evidence from the Survey of Consumer Finances “ September 2020 Vol. 106, No. 5. Link
-
FED Bulletin, Sep 2017. “Changes in U.S. Family Finances from 2013 to 2016: Evidence from the Survey of Consumer Finances” September 2017 Vol. 103, No. 3. Link
-
SIFMA Insights, Oct 2019. “Who Owns Stocks in America? A: Individual Investors A Chart Book on Stock Ownership” October 2019. Link
-
Gallup Survey 2020. “What Percentage of Americans Owns Stock?”, Lydia Saad, 4 June 2020,
-
Gallup Survey 2020. Stock market survey. Link
-
FT, Feb 2020. “How America’s 1% came to dominate equity ownership”, Robin Wiggles, 11 February 2020. Link
-
Statista 2020. M. Szmigiera, Feb 28, 2020. Link
- Urban-Brookings Tax Policy Center, Steve Rosenthal and Theo Burke. “Who’s Left to Tax? US Taxation of Corporations and Their Shareholders.” Oct 2020. Link